Power Logging & Analysis
Logging your power.
Analysing every parameter.
Quantifying the savings.
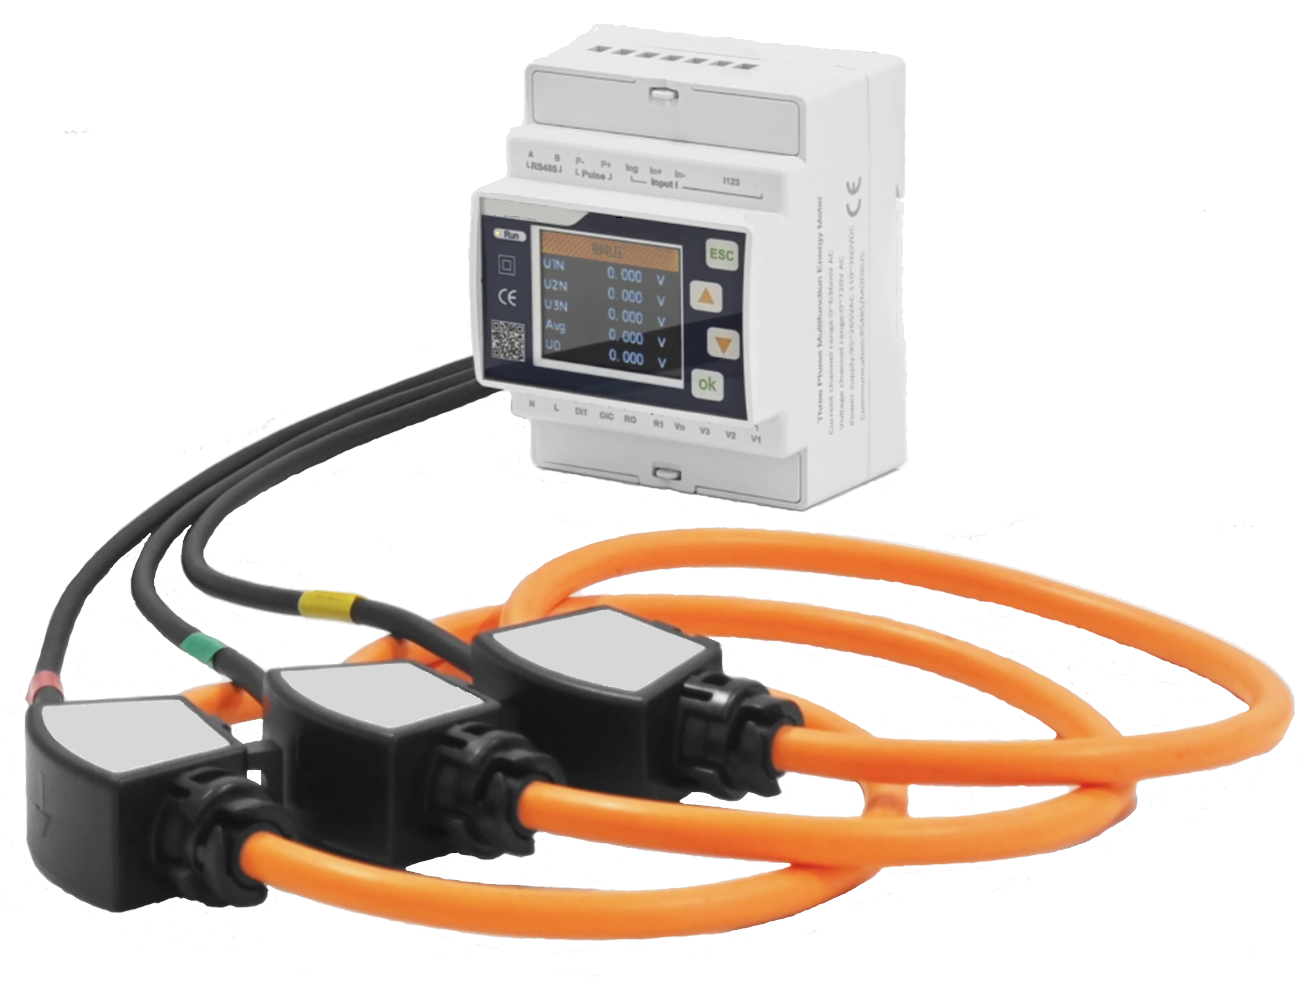
Power logging: on-site, granular (1-minute intervals) logging of your power demand parameters (Amps, Volts, Power Factor, kW, kVA, kVAr, harmonics) by phase and phases combined.
Power analysis dashboard: upload your own logged power data or use Panda-logged data. Normalise data for missing time-stamps.
Dashboard: Data visualisation, date-time range zooming, parameter selection, by phase, by phases compared, by phases combined. Download your raw data in Excel customise your PDF report and excel download.
Dashboard: Data visualisation, date-time range zooming, parameter selection, by phase, by phases compared, by phases combined. Download your raw data in Excel customise your PDF report and excel download.
Explore your power data on your own dashboard by phase and combined — or have Panda install a logger on site. Download raw / normalised data in Excel + a standard PDF report.